logo

Crossbeam

Business Intelligence (BI) tool that examines and reports on branch, brand, category,
department and product performance & trends from sales data uploads.

Best Performers page of AltoBook app

Business Intelligence you can Trust

Making data and trend analysis available to all. Delivering rich insights on your data extractions. Focused on small to large businesses that are ready to gain a greater insight. Crossbeam's uploader and aggregation processes are automated. These automated processes make it so that the only people looking at your data are the users that you have added. If you need to change the data for a particular date, then just remove the period and resubmit. Crossbeam will make sure all your pre aggregated reports are up to date with the changes. Good reports are made to be shared. Give your users a login to your Crossbeam account and manage their report views from your User Management page. Each chart and table can be downloaded for your own reporting.

Fast and Reliable Transactional Data Analytics

As soon as you sign up with Crossbeam, we are ready to take your data and turn it into insight. Once you have sent us the files then we will begin processing it and return quickly with your first results. Larger files will take longer to process than smaller ones but our cloud-based solutions have been built for speed and precision. Crossbeam's simple and intuitive uploader is easy to use and puts control in your hands. No need to be a programmer to get insights from your data. Our automated tools do the work for you. Just upload or SFTP the files to us and we will automatically process these. If you want to use a file format that you already have then just go to our data mapping page and add this format.

Category Viewer page of AltoBook app
Individual Performance page of AltoBook app

Gain Insight at a Good Price

Crossbeam features, storage and licences has been clearly priced. Crossbeam has been built for ease of use whether you are uploading files, running reports or adding new users. When you buy a package, you know immediately what you will get. No surprises or unexpected costs will come your way. Our contracts are for 1 month at a time and the price remains consistent so you can use Crossbeam for the length of time that is right for you without losing out. We make it easy to switch plans and cancel your contract from within the Crossbeam app. Just flick a switch requesting a plan change or to cancel your subscription and confirm.

Easy Navigation

Crossbeam has been built to be user-friendly. Each report is clearly labelled and every option self-explanatory. Every page has several information icons that can be hovered over to understand more about the feature under review. Any further questions, then just use the in-app support message form or live chat to ask questions and learn more. We are happy to help you in getting the most out of Crossbeam.

Managing data from multiple industries in one place. Making data analytics easier, we provide a user friendly interface to invite your contacts to share data and make it easier than ever to gain true near real time analytics from multiple sources.

  • Analyse data from all your departments in one place.
  • Be in control of your data.
  • Taking the time to understand the problem.
Quick Navigation page of Crossbeam app

Features

Check out what is included with the Crossbeam package.

Our payment system provides detailed analytics to help you understand and optimize your payment processes.
Secure Subscription to Tillit Software as a Service

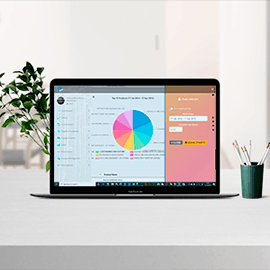
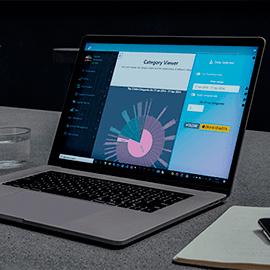
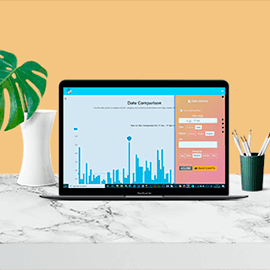
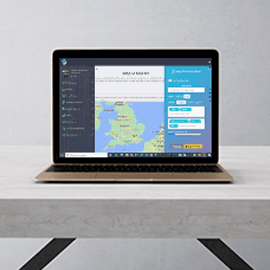
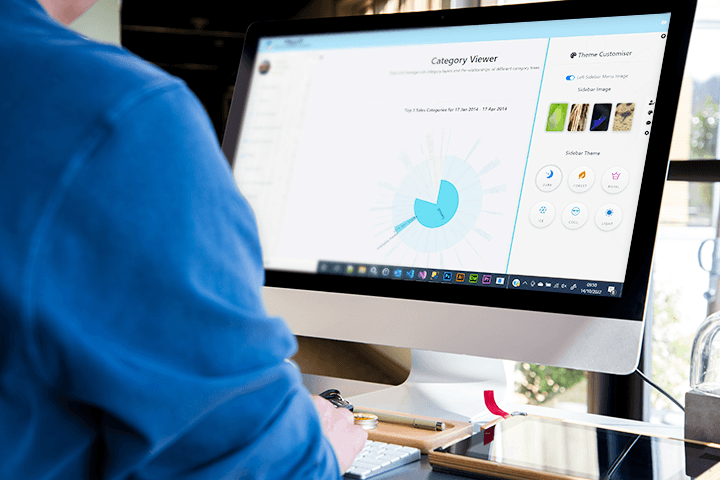
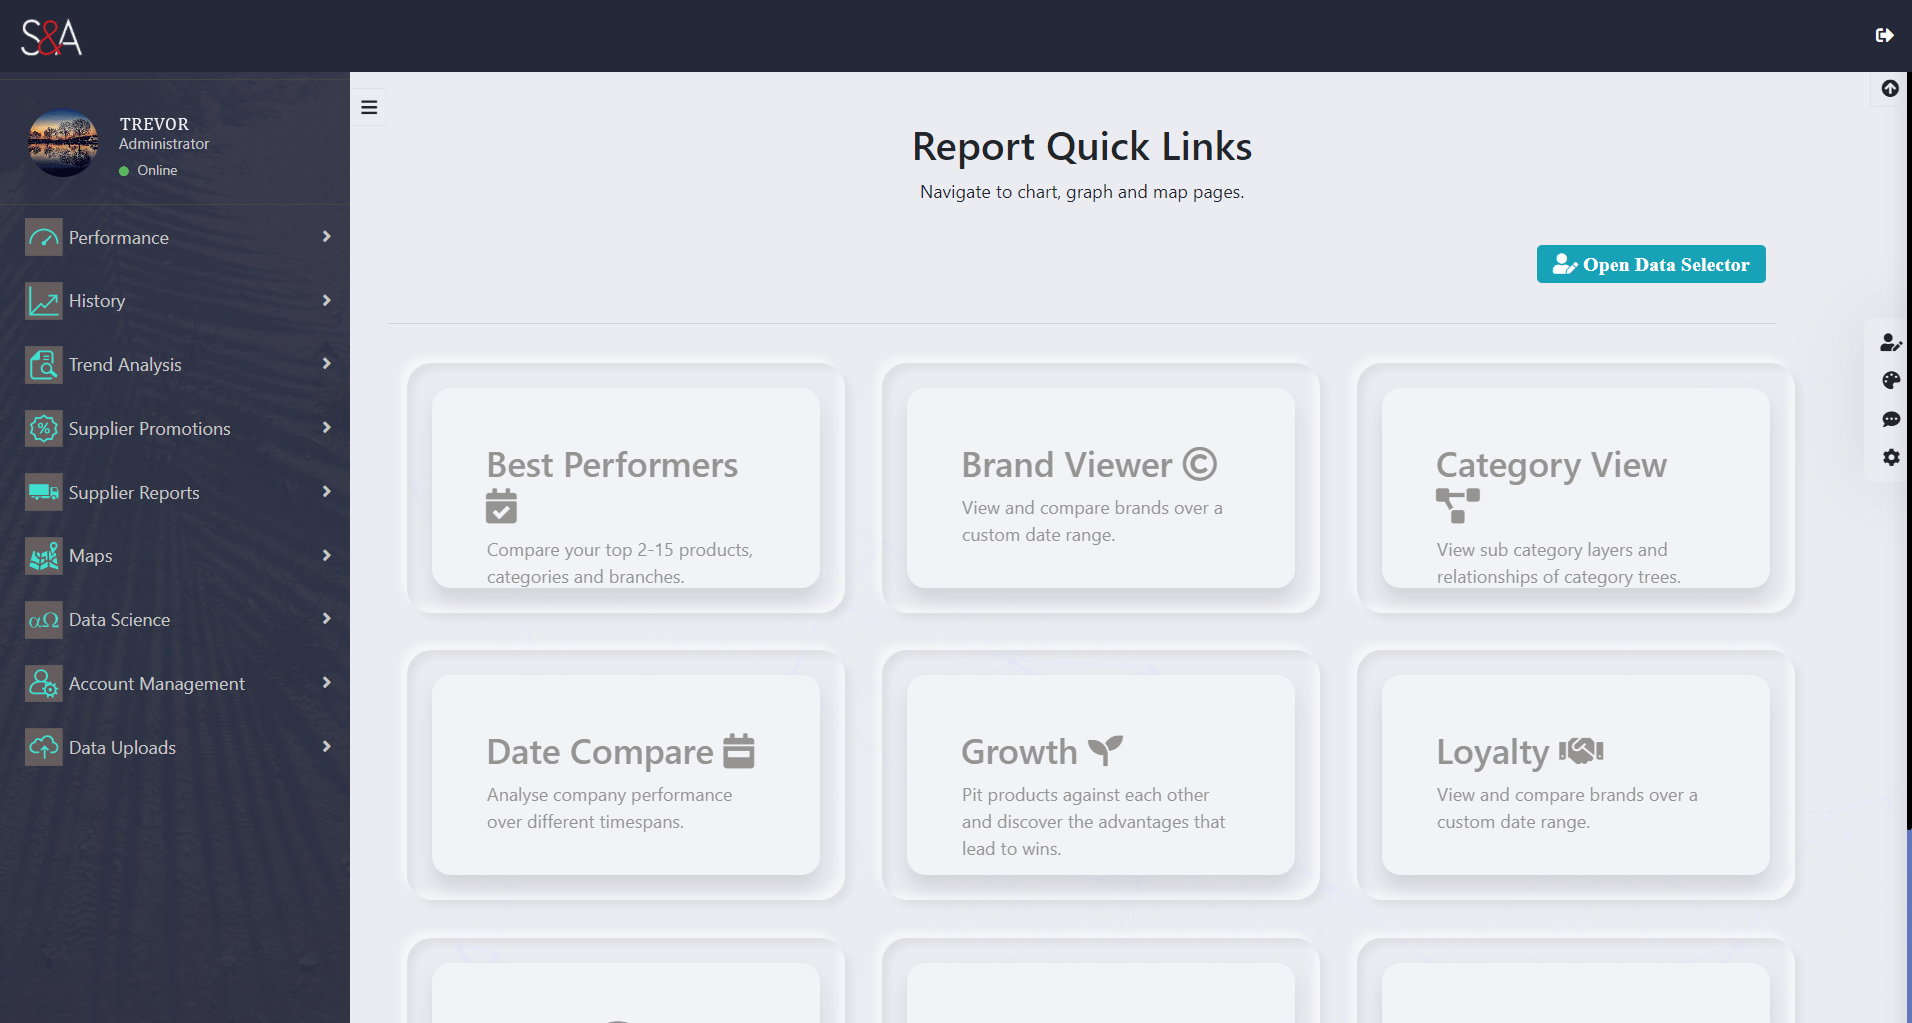
Tillit is a cloud-based platform that allows you to upload sales transactions from your tilling systems and perform detailed analytics to gain a better understanding of your business performance and trends. With fast and immediate analytics, Tillit is accessible from any device with a modern browser, making it easy to create reports and key performance indicators (KPIs) that can help your business grow. The platform also features interactive and customizable charts, making it easy to create visually appealing reports. Tillit is a competitive and cost-effective solution, with transparent pricing and a user-friendly interface that is suitable for businesses with small or busy IT departments.

Collaborate with your company and suppliers to add, edit, and manage your business data extracts.
Collaborate with your Team and Viewers

With our platform, you can share reports with your team by giving them user licenses. You can easily reassign licenses in the User Management panel, and use it to track each license holder's activity to ensure that they are making the most of their access. You can also give viewer licenses to suppliers and manufacturers, allowing them to see your business performance where their interests are. Users can have access to all reports, and you can individually set their access to upload, export, and map data. Viewers will only be able to see the reports that you have granted them access to, making it a convenient way to share your data.

Discover trends, understand your business performance, and identify marketing opportunities to help you grow your business.
Analyse Trends in your Sales and Purchase Data

Tillit reports can help you understand how your business is performing, and identify areas for improvement. You can view reports to see how each area is meeting performance targets, and discover ways to boost sales of specific items in underperforming areas. You can compare different time periods, such as year-to-date (YTD), year-on-year (YOY), moving annual total (MAT), this month versus last month (TM vs TM - 1), and running rate 3 months versus running rate 6 months (RR3 vs RR6). You can also group results by days, weeks, months, quarters, or years to get a more detailed understanding of your business performance.

Byteal's machine learning algorithms will identify new patterns and trends in your data.
Run Machine Learning Algorithms on your Data Extracts

Use Tillit's flexible market basket analysis algorithm to analyze various basket configurations and gain insights from the results. The MBA is flexible and allows for the input of various cross-category items, and the results can be used to understand customer behavior. Utilize these results to increase item sales through targeted email marketing campaigns and in-store product placements. Additionally, use the trained machine learning model to forecast sales for the upcoming months. Obtain results based on individual store location or categories, and use these predictions to inform marketing decisions and drive sales. Additionally, utilize the matrix factorization algorithm to make product recommendations to customers based on their purchase history, helping to increase sales and expose customers to products they may be interested in.

Use our customisable filters to improve your ability to view and understand your data.
Select the Data you are Most Interested In

Use the data selector to choose the period and data to be analyzed. View the results of interest or experiment with different search options to uncover new business insights. Compare your branches, brands, categories, departments, or products to one another and identify when sales are highest for these items. Use this insight to inform changes in your store and increase sales. Use predefined dates for quick reporting, and set Tillit to remember your data selector history to easily access past reports.

Examine trends in different regions.
View Analytics on the Map

Use the Map Feature to view branch performance and customer location trends. Observe, on an interactive area map, where customers are coming from and what they are interested in. Explore geographical variations in customer product preferences. Search within a dynamic radius from an area or branch, or alter the customer spend to visualize shopping activity.

Tillit provides multiple methods for collecting and uploading your data.
Intuitive Data Mapping and Uploader with Instant Data Processing

You can submit your transaction data according to our file specifications, or use the data map feature to set the files to a format that is most convenient for you. The automated uploader will process the sales orders and related information once a complete set has been uploaded. The system is designed to make it easy to update data. If the information uploaded is incorrect, simply delete the period and resubmit the correct files. With Tillit, you can upload flat files, connect to your data sources through Tillit, or SFTP files directly to us.

Price Plans for Crossbeam

Want to go up or down a plan during your contract? We've made that easy to do. Just use the Tillit settings to make changes whenever you want. Each service is for a 1-year period.

Pay Monthly Plan
Pay Yearly Plan

Company Essential

Ideal for businesses that want to better understand their data internally with monthly paymentswith a minimum contract of 12 months.

£499.99/pm

Normally £574.99

Top Features

  • Performance Comparisons
  • Trend Analysis
  • Map Visualisation
  • Data Mapping and Uploader

Business Plus

Ideal for businesses that work with external suppliers and other businesses to analyse their data together with monthly payments for 1 year minimum contract.

£699.99/pm

Normally £804.99

Top Features

  • Market Basket Analysis (MBA)
  • Supplier Promotions
  • Red Flags
  • All Company Essential Package Features

Deep Insight

Ideal for businesses that want to use machine learning to better understand their data and predicted future trends with monthly payments for 1 year minimum contract.

£899.99/pm

Normally £1,034.99

Top Features

  • Sentiment Analysis
  • Product Recommendations
  • Sales forecasting
  • All Business Plus Package Features

Plan Comparison

View Specifications for each Plan

Compare our three packages. Custom feature packages are available, please contact us to make arrangements.

Essential
Plus
Advanced

Monthly Price

£499.99/pm
£699.99/pm
£899.99/pm

Yearly Price

£5,399.99
£7559.99
£9719.99
Uploads and Storage

Sales Data Uploads

5GB/month

10GB/month

30GB/month

Maximum Database Storage

10GB

30GB

50GB

Photo Uploads

200/month

500/month

1000/month

Uploader

Performance Analysis

Individual Comparisons

Quick Insights

Year in Review

Customer Analysis

Profit Reports

Profit Margin

Sales Achievements

Trend Analytics

Trend Dashboard

Seasonal Trends

Summary by Month

Supplier Share

Supplier Promotions

Pay for Performance

Summary by Month

Supplier Share

Maps

Map Visualisations

Red Flags

Forum Access

Pairings Report

-

Data Science

Market Basket Analysis (MBA)

-

Product Recommendations

-

-

Sales Forecasting

-

-

Sentiment Analysis

-

-

Crossbeam FAQs

Frequently Asked Questions about Crossbeam

Check out our most common questions about Crossbeam.

  • Once you have completed payment you will be granted access to Crossbeam. It is ready to receive your data immediately and you can see the results once the upload is complete. Larger datasets will take longer to process. You can check out the upload progress in your uploads manager.

  • We want your business to succeed as much as you do. If you have changes that you want made that are not automated then just let us know and we can edit your site for you.

  • If you do not want to match our file specifications then we provide a data mapping tool that allows you to decide the format that is right for your business. Just go through each file type until the design is right for you.

  • Under certain circumstances, we can offer early exit options if you need to end your contract before it is complete.

  • We love talking about our products! If you have any questions on how to use AltoBook or want some one on one tips in getting the most out of AltoBook for your business, then drop us a message or visit us on our online chat.